 Prometheus笔记
# 简介
- 内置时间序列数据库 TSDB
- 前 Google 工程师开源
- 第二个加入 CNCF 基金会的项目(第一个是 Kubernetes)
# 特点
- Pull 模型:可理解为,Prometheus 服务有一个爬虫程序,定时通过 HTTP 请求爬取要监控服务的数据。
- 单机存储:数据存储在 Prometheus 服务主机下
# 数据采集方式
# 客户端 (Exporter) 视角
就客户端而言,可分为:
- 主动推送:对于短作业的程序来说,可能会遇到还没等到被动抓取时,作业就已经结束了,这就适用主动推送到 Pushgateway。
- 被动抓取:Prometheus server 主动请求客户端的接口抓取数据
# 服务端 (Prometheus server) 视角
就服务端 (Prometheus server) 而言,就只有一种主动抓取(Pull 模型)方式来采集数据,区别在于是直接从客户端 (Exporter) 抓取,还是间接从 Pushgateway 抓取到客户端数据。
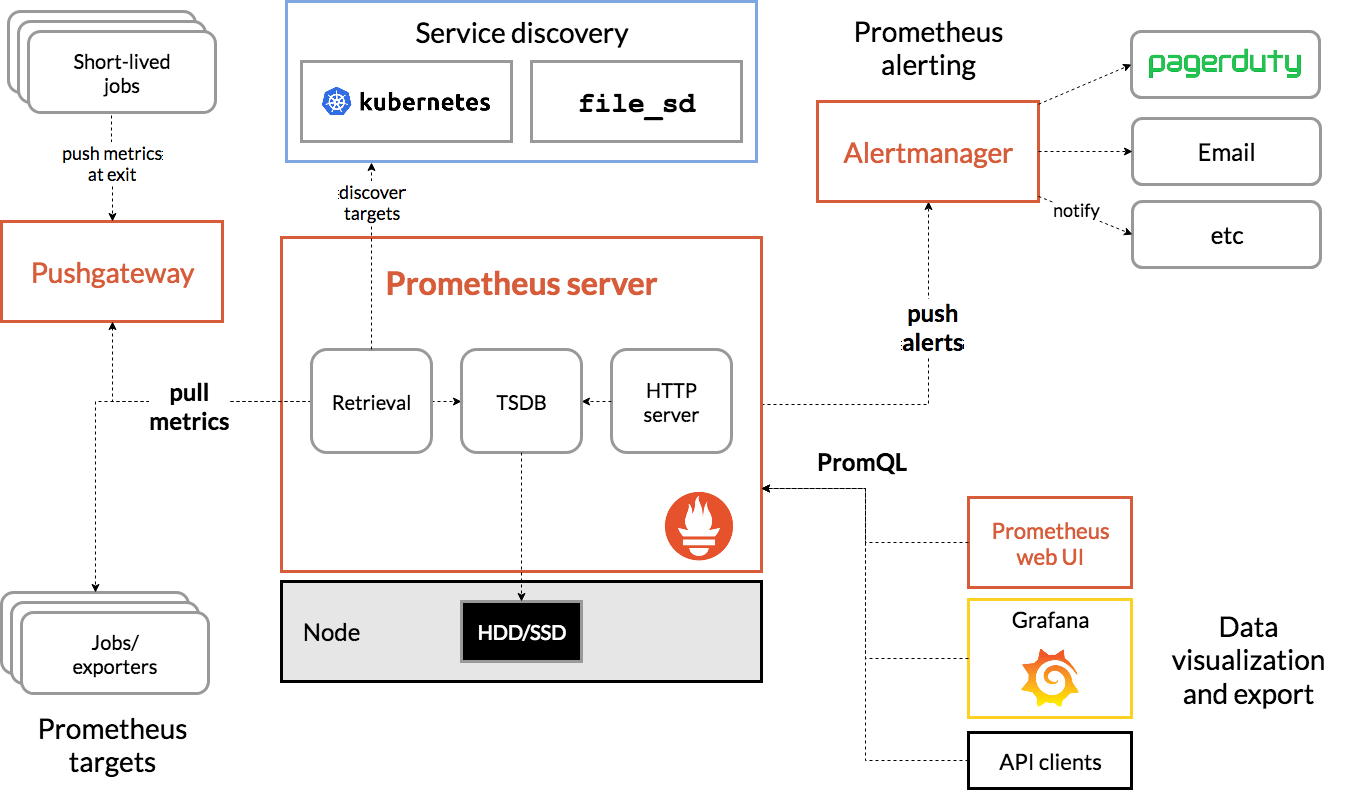
# 架构
 Download | Prometheus (opens new window)
基于 prometheus 提供的程序来区分架构:
Download | Prometheus (opens new window)
基于 prometheus 提供的程序来区分架构:
- Prometheus server:服务端,一个内置爬虫程序的时序数据库
- Exporter:客户端,将不同客户端环境下的数据以 HTTP 接口暴露,供 Prometheus server 爬取;有时等不及也可主动推送给 Pushgateway
- Pushgateway:数据中转站,接收 Exporter 的数据,等待 Prometheus server 抓取
- Alertmanager:告警服务
# 安装
# Helm
prometheus 25.28.0 · prometheus/prometheus-community (opens new window)
# Prometheus server
服务端,也就是 Prometheus 本体
- 使用 go 编写,执行程序目录中的
./prometheus启动,配置文件为prometheus.yml
# 内置组件
TSDB:时序数据库,用于存储、查询数据Retrieval:用于从Pushgateway、Exporter爬取数据Service discover:用于动态发现监控目标HTTP server:对外提供 HTTP 服务
# prometheus.yml
Configuration | Prometheus (opens new window)
对于 prometheus 服务来说,主要是跟 prometheus.yml 配置打交道。
# global
scrape_interval:拉取数据的时间间隔scrape_timeout:抓取超时时间evaluation_interval:规则验证(生成 alert)的时间间隔
# scrape_configs
scrape_configs:
  # 作业名称,必须是唯一
  - job_name: "prometheus"
    # 默认通过http协议爬虫/metrics路径下的数据
    static_configs:
      - targets: ["localhost:9090"]
    labels:
      # 添加标签 environment=production
      environment: "production"
# 网页服务
默认端口 9090
- Status
- Targets:查看要采集的服务状态
# Exporter
- 客户端,泛指一类程序,根据不同的场景,有与之对应的 exporter 程序;
- 通常 exporter 启动后,会监听一个 http 端口,供 Prometheus server 抓取数据
注意这个端口内容无需鉴权,也就是任何人都可以看到这些数据。
# node_exporte - Linux 监控
prometheus/node_exporter: Exporter for machine metrics (opens new window) 用于 Linux 系统硬件监控
# 系统服务
# 下载
wget https://github.com/prometheus/node_exporter/releases/download/v1.8.2/node_exporter-1.8.2.linux-amd64.tar.gz

# 解压
tar -zvxf node_exporter-1.8.2.linux-amd64.tar.gz

# 移动
sudo mv node_exporter-1.8.2.linux-amd64 /etc/node_exporter
# 方法一:下载配置
wget https://raw.githubusercontent.com/prometheus/node_exporter/refs/heads/master/examples/systemd/node_exporter.service

# todo


# 方法二:手动配置
sudo nano /etc/systemd/system/node_exporter.service

[Unit]
Description=Node Exporter
Wants=network-online.target
After=network-online.target

[Service]
ExecStart=/etc/node_exporter/node_exporter
Restart=always

[Install]
WantedBy=multi-user.target


# 启动
sudo systemctl daemon-reload  # 重载
sudo systemctl enable node_exporter # 开机启动
sudo systemctl restart node_exporter # 重新启动
sudo systemctl status node_exporter # 查看状态

# 测试
curl 127.0.0.1:9100/metrics
# Docker
适合有 Docker 的环境
docker run -d \
  --net="host" \
  --pid="host" \
  -v "/:/host:ro,rslave" \
  quay.io/prometheus/node-exporter:latest \
  --path.rootfs=/host
# --web.listen-address=":9200"
启动后,执行: curl 127.0.0.1:9100/metrics 检查是否正常
# Docker compose
compose.yaml
services:
  node_exporter:
    image: quay.io/prometheus/node-exporter:latest
    container_name: node_exporter
    command:
      - '--path.rootfs=/host'
    network_mode: host
    pid: host
    restart: unless-stopped
    volumes:
      - '/:/host:ro,rslave'
# 启动
docker compose up -d

# 测试
curl 127.0.0.1:9100/metrics
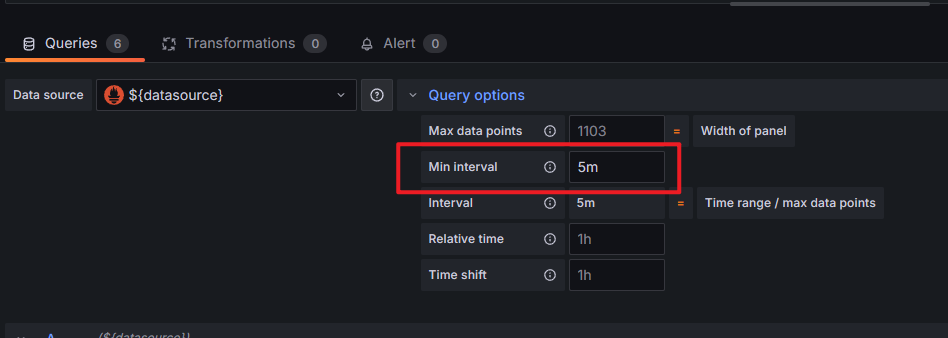
在电脑显示 No Data,在手机能正常显示,抓包发现跟请求的 intervalMs 参数有关,发现这些数据是间隔 5 分钟采样一次的,电脑请求时 intervalMs=1m ,而手机为 5m ,一番查找发现将 Query options - Min interval 修改为 5m 可正常在电脑显示(实际上 2m 也可以,自行尝试)。
# dcgm-exporter - N 卡监控
- NVIDIA/dcgm-exporter: NVIDIA GPU metrics exporter for Prometheus leveraging DCGM (opens new window)
- DCGM-Exporter — NVIDIA DCGM Documentation latest documentation (opens new window)
dcgm = datacenter-gpu-manager
sudo apt-get install -y nvidia-container-toolkit
# Docker
nvidia/dcgm-exporter Tags | Docker Hub (opens new window)
docker run -d \
--gpus all \
--restart=always \
-p 9400:9400 \
nvcr.io/nvidia/k8s/dcgm-exporter:3.3.8-3.6.0-ubuntu22.04

# 测试
curl localhost:9400/metrics
# Docker Compose
services:
  dcgm-exporter:
    image: nvcr.io/nvidia/k8s/dcgm-exporter:3.3.8-3.6.0-ubuntu22.04
  deploy:
    resources:
      reservations:
        devices:
          - driver: nvidia
            count: all
            capabilities: [gpu]
    ports:
      - "9400:9400"
    restart: unless-stopped
# 启动
docker compose up -d

# 测试
curl localhost:9400/metrics
# 加载指标
默认情况下,DCGM 只开启了部分指标监控,覆盖 /etc/default-counters.csv 开启其他指标:
# github
wget https://raw.githubusercontent.com/NVIDIA/dcgm-exporter/refs/heads/main/etc/default-counters.csv

# 国内加速
wget https://ghp.ci/https://raw.githubusercontent.com/NVIDIA/dcgm-exporter/refs/heads/main/etc/default-counters.csv
监控指标参考:Field Identifiers — NVIDIA DCGM Documentation latest documentation (opens new window)
以风扇转速 DCGM_FI_DEV_FAN_SPEED 为例:
vim default-counters.csv

# 添加
DCGM_FI_DEV_FAN_SPEED, gauge, Fan speed for the device in percent 0-100.
挂载文件:
dcgm-exporter:
  image: nvcr.io/nvidia/k8s/dcgm-exporter:3.3.8-3.6.0-ubuntu22.04
  volumes:
    - ${PWD}/default-counters.csv:/etc/default-counters.csv
# Grafana 模版
- NVIDIA DCGM Exporter Dashboard | Grafana Labs (opens new window)
- dcgm-exporter/grafana/dcgm-exporter-dashboard.json at main · NVIDIA/dcgm-exporter (opens new window)
实践发现 Grafana Labs 中的版本并不是最新的,功耗显示是有误的,建议使用 git 仓库中的 dcgm-exporter-dashboard.json 导入
# Pushgateway
数据中转站,职责:
- 接受客户端 (Exporter) 主动发送的数据
- 响应服务端 (Prometheus server) 拉取数据请求
# Alertmanager
告警服务
# PromQL 查询语言
# 存储流程
在查询之前,需要对存储在 TSDB 的数据结构有所了解。
通过访问 https://prometheus-server/metrics ,可得到一段下述数据:
prometheus_http_requests_total{code="200",handler="/"} 0
prometheus_http_requests_total{code="200",handler="/-/healthy"} 408646
prometheus_http_requests_total{code="200",handler="/-/quit"} 0
prometheus_http_requests_total{code="200",handler="/-/ready"} 1.22594e+06
prometheus_http_requests_total{code="200",handler="/-/reload"} 1
prometheus_http_requests_total{code="200",handler="/alerts"} 0
不难看出,其中的一条,如 prometheus_http_requests_total{code="200",handler="/-/healthy"} 408646 的含义是:
- 指标名称:
prometheus_http_requests_total - 标签(参数):
- code(状态码):
200 - handler(请求路径):
/-/healthy
- code(状态码):
- 产生次数(请求次数):
408646
这样一条数据将会存储到 prometheus 的时序数据库,在存储时还会额外添加 prometheus.yml 配置的 job 、 instance 信息作为标签,最终存储为:
prometheus_http_requests_total{code="200", handler="/-/healthy", instance="localhost:9090", job="prometheus"}
408673
# 基本查询
# 查询所有 prometheus_http_requests_total
prometheus_http_requests_total
#   等同于
prometheus_http_requests_total{}

# 过滤标签
prometheus_http_requests_total{code="302"} # 等于
prometheus_http_requests_total{code!="302"} # 不等于

# 正则

# 时间范围,默认为当前时间(瞬时向量)为基准
prometheus_http_requests_total{}[5s] # 最近5秒

# 时间位移
prometheus_http_requests_total{}[] offset 5m # 以前5分钟为基准
prometheus_http_requests_total{}[5s] offset 5m # 以前5分钟为基准,最近5秒

# 聚合
sum(prometheus_http_requests_total{}) # 总数量(请求数量)

# 按标签匹配
{code="200"}
# 聚合查询
数量前 n 条
topk(n,查询语句)
# 基于 Consul 的服务发现
基于 Consul 的服务发现 | prometheus-book (opens new window)
# 安装 服务端(K8s)
helm repo add hashicorp https://helm.releases.hashicorp.com
helm install my-consul hashicorp/consul --version 1.8.1
部署后得到以下服务:
- DNS 服务:可通过此 DNS 服务器请求解析注册服务的 IP
# node查询
<node>.node.consul

# service查询
<service>.service.consul
# 安装 客户端(被监控机)
Install | Consul | HashiCorp Developer (opens new window)
wget https://releases.hashicorp.com/consul/1.21.4/consul_1.21.4_linux_amd64.zip
unzip consul_1.21.4_linux_amd64.zip
sudo mv consul /usr/local/bin/
sudo mkdir /etc/consul.d

echo '{"service": {"name": "node_exporter", "tags": ["exporter"], "port": 9100}}' \
    | sudo tee /etc/consul.d/node_exporter.json
服务
- name: Create systemd service for Consul agent
  copy:
    dest: /etc/systemd/system/consul.service
    content: |
      [Unit]
      Description=Consul Agent
      After=network.target

      [Service]
      User=root
      Group=root
      ExecStart={{ consul_bin_path }} agent \
        -data-dir={{ consul_data_dir }} \
        -config-dir={{ consul_config_dir }} \
        -config-file /etc/consul.d/node_exporter.json \
        -client=0.0.0.0 \
        -join={{ consul_join_ip }}
      Restart=on-failure
      LimitNOFILE=65536

      [Install]
      WantedBy=multi-user.target
    owner: root
    group: root
    mode: '0644'
# 更新 Prometheus 配置
- job_name: node_exporter
  metrics_path: /metrics
  scheme: http
  consul_sd_configs:
    - server: my-consul-consul-server.default:8500
      services:
        - node_exporter
  relabel_configs:
  # 把 Consul 节点名 label "__meta_consul_node" 映射成 job
  - source_labels: ["__meta_consul_node"]
    target_label: "job"
  # 2. 添加固定 label,比如环境
  - target_label: "node_type"
    replacement: "worker"